Published on Friday, 13 Apr, 2018
Mapping a technology ecosystem
 Sally Lait
In this post I’m going to be looking at capturing a view of the technology that we have in play, why this can be important, and how we can do it.
Working on a recent project, I tweeted that I was “Kicking off the week with a workshop to map out a technology (+non-tech bits!) ecosystem, look at the processes and data flows, the people involved, and start to think about opportunities and changes. One of my favourite types of work :)”
I was working with another consultant to help a business sense-check what they were doing, and to make recommendations to feed into their digital strategy. We were also helping an internal team to communicate plans into the wider business through creating a roadmap, and telling the story around (not about) technology.
I got a question back from Ian Kynnersley (@kpopper) on Twitter: “Do you have any particular frameworks or techniques you use for this?” so thought I’d write up a response. In this post I’m going to be focusing on the former part - mapping out an ecosystem - as the rest of it is going to be covered in some planned upcoming posts (stay tuned!).
What is a ‘technology ecosystem’?
When it comes to talking about an ‘ecosystem’, you want to be thinking holistically. Wikipedia has a short page on digital ecosystems, but I like their natural ecosystem page much better because it’s less about buzzwords.
What we’re thinking about is:
- A specific, limited space
- That can be of any size
- And includes a number of individual components
- Which interact with each other and their environment
One of the other reasons that I like to explicitly consider the term’s biological origins is to highlight the impact that people can have on an ecosystem. Just as we can fell the rainforests, pollute the seas, or change migration patterns, so we can also play havoc with a technology ecosystem’s ‘natural’ (intended!) state or find ways to augment it when it’s not working the way that we’d like.
The boundaries are yours to define. You may want to consider the ecosystem around every possible task and interaction that your company has in play, or more specific areas including your website, in-house systems, or a scenario like booking tickets. In my tweet I mentioned non-tech elements, and this is something that I often like to include where there are relevant interactions. The scope that you choose will be related to your goals.
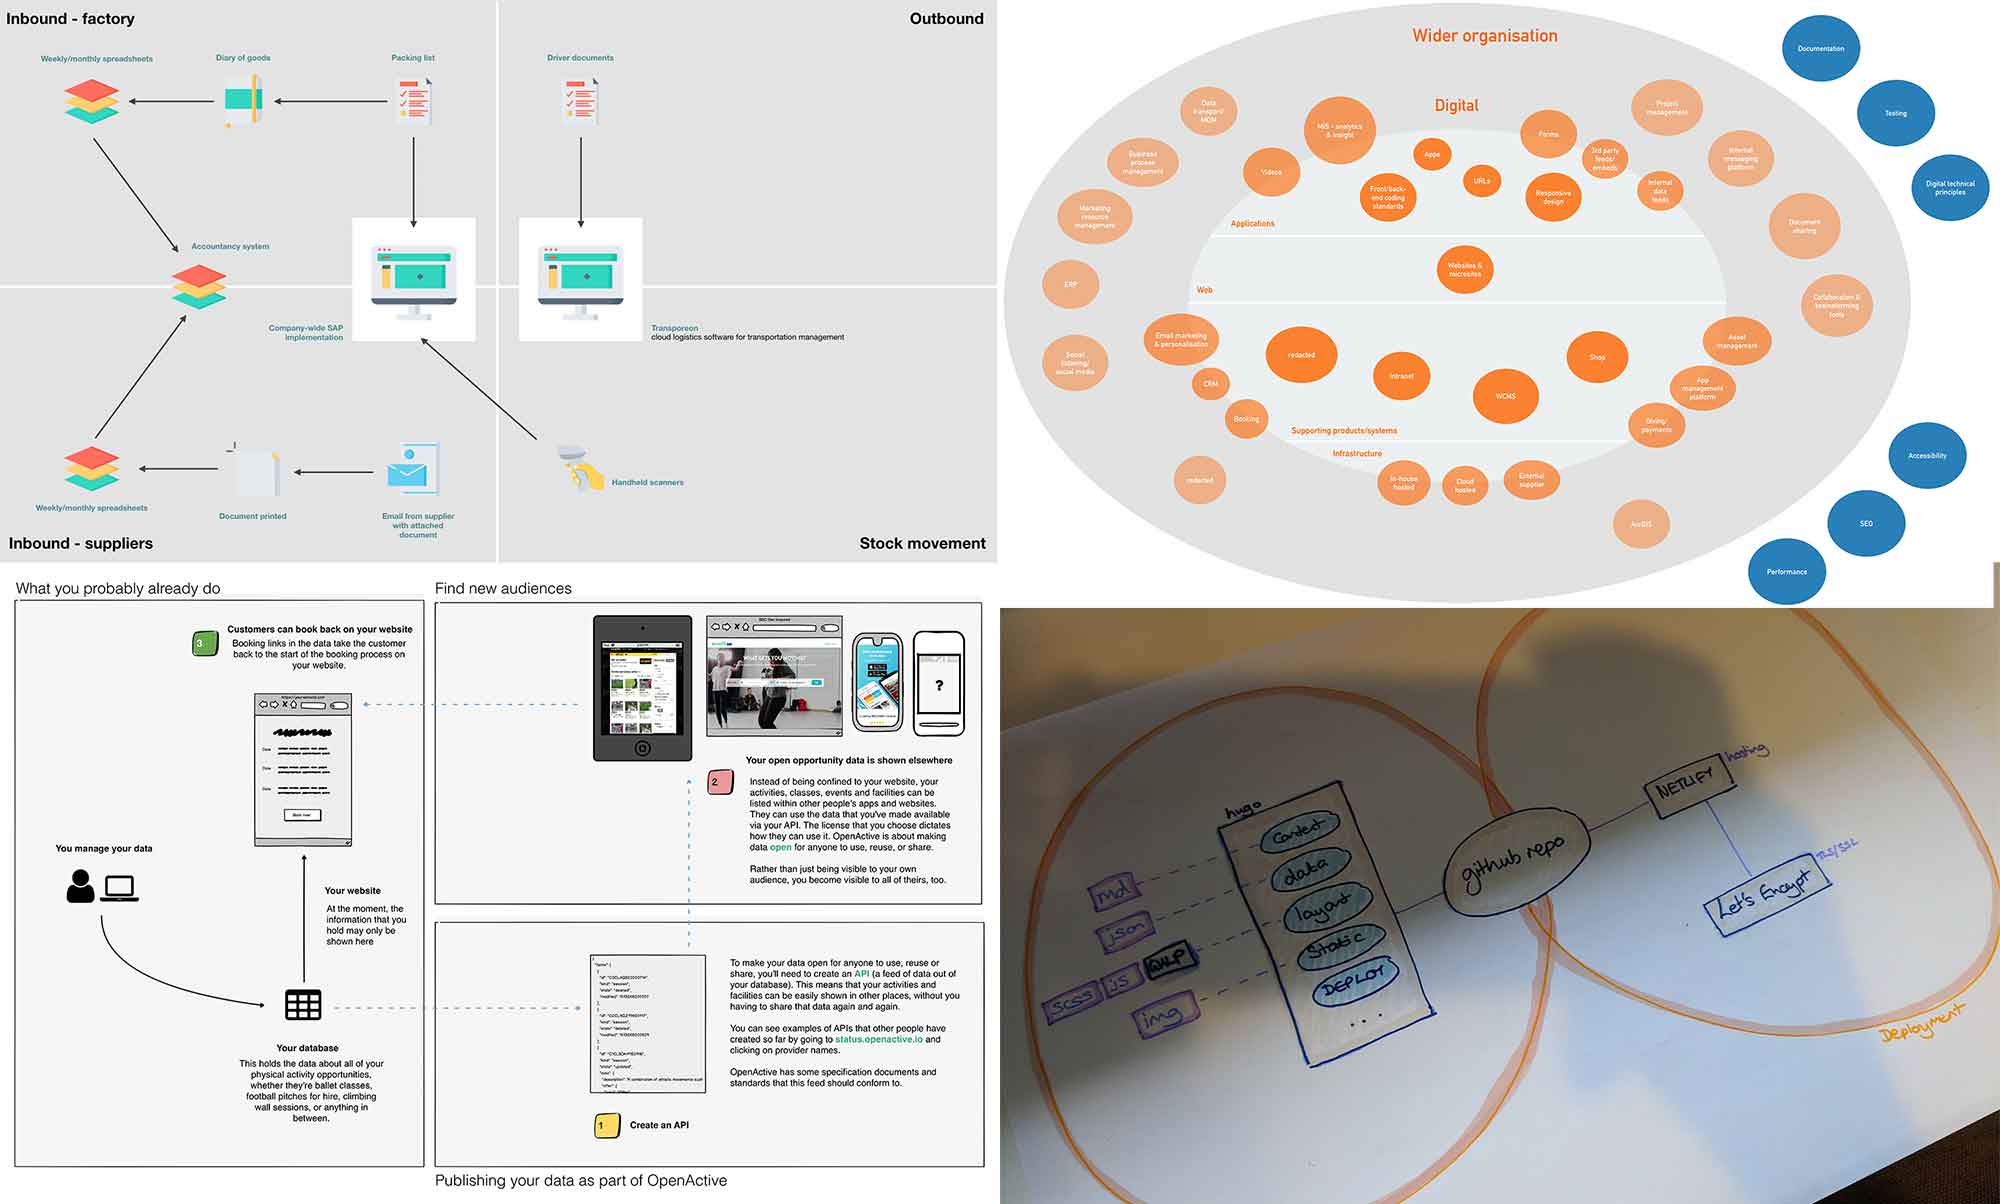
A few examples from projects that I’ve worked on:
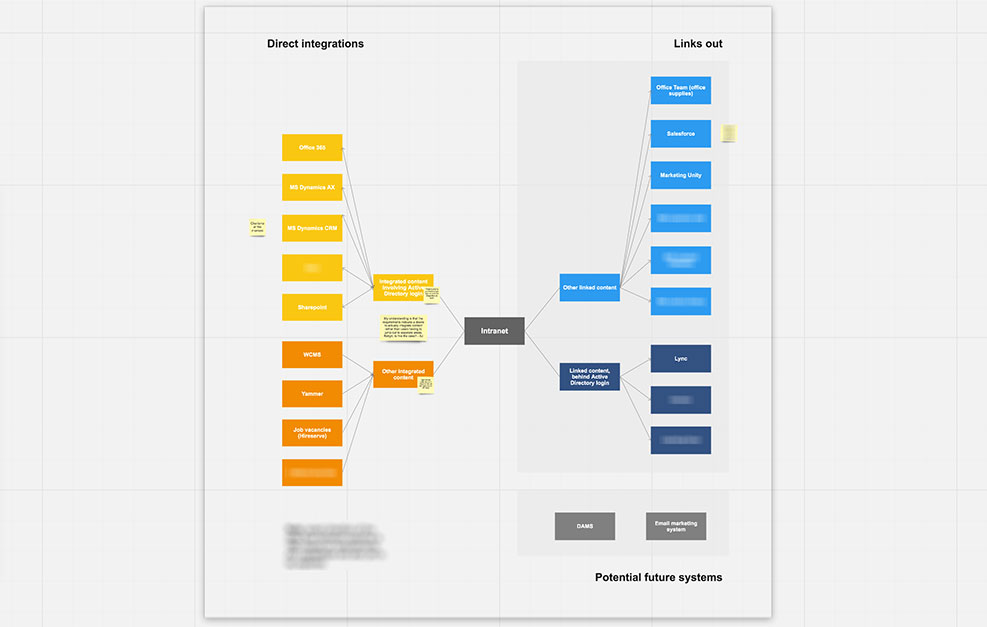
Giving external agencies a view of all of the touchpoint and elements involved in the redevelopment of an intranet system, as part of the invitation to tender.
Providing a snapshot of the ecosystem over time, in order to help a department tell the story of changes that have been made so far, and the future vision.
Visually highlighting how technology is able to support and enhance the user experience through making some changes to the overall ecosystem.
Mapping out all of the elements in play, for a digital team to better understand how changing their development process to embrace patterns would affect everything.
Why can mapping this be useful?
I often include some kind of an ecosystem mapping in the early stages of a project because I find that it can be a really useful communication tool for everyone involved.
By putting together this kind of an asset and having it to refer to as part of your conversations it can help people to:
- Take stock - maybe you’re new, or maybe nobody actually knows everything and needs a chance to capture it!
- Understand the scale/level of complexity; see both the big picture and detail.
- Understand relationships and dependencies.
- Visualise and talk through what’s hit by different types of user interactions (this can help with understanding priorities and importance).
- Identify where there are common elements, and where re-use can be improved.
- Spot efficiencies and opportunities.
- Shine a light on areas where there’s perhaps over-use of technology, and not supporting other experiences.
- Plan a roadmap by better viewing the moving parts involved.
- Form and express ideas - diagrams are better for conveying this kind of information than words alone.
How does this differ from a technical architecture, or a process flow diagram?
For me there’s a big difference, and the clue’s in the names: technical architecture or process diagram. In what we’re setting out to do, we’re neither sticking exclusively to technical elements, or steps in a single process. We want the whole ecosystem.
In terms of architecture diagrams, you may have many of the same concepts, but present it differently - think terminology and naming, or level of detail (‘database’, rather than naming specific technologies/formats). Likewise, we’ll likely have information that’s contained within individual processes, but want the holistic view.
We may also not just be sticking to technical concepts. It may be important to show that someone is creating a spreadsheet weekly which is not integrated with anything else but covers a crucial activity. Or that someone is sending tweets and copying the text to instagram. Maybe someone prints things, writes on them, and hands them to someone else.
These aren’t all ‘technology’, and may not be found within some technical architecture diagrams. They are however very useful to know about, and can highlight important considerations within our overall ecosystem.
It’s also important to note that the relationships between elements don’t have to be linear. In some of the example above there are direct lines of action, but in the top right you’re able to see relationships represented by location, colour, and proximity.
However, it’s important to remember that if you get this wrong, there’s a risk of not being taken seriously - if someone is actually expecting an architecture diagram following a formal methodology and you give them something more general, they could view this as a lack of skill or technical capability.
When approaching this kind of mapping it’s really important to know who you’re doing it for, and why. This may alter your presentation, language and level of detail.
How to map it
Putting your mapping together can be done as an individual activity, or by a group.
In a group
Groups and workshop settings are great for this, as it means that you can quickly gather a well-rounded perspective from everyone in the room. If there are any misunderstandings, then they can be ironed out quickly rather than hearing incorrect something from one person and needing it corrected later.
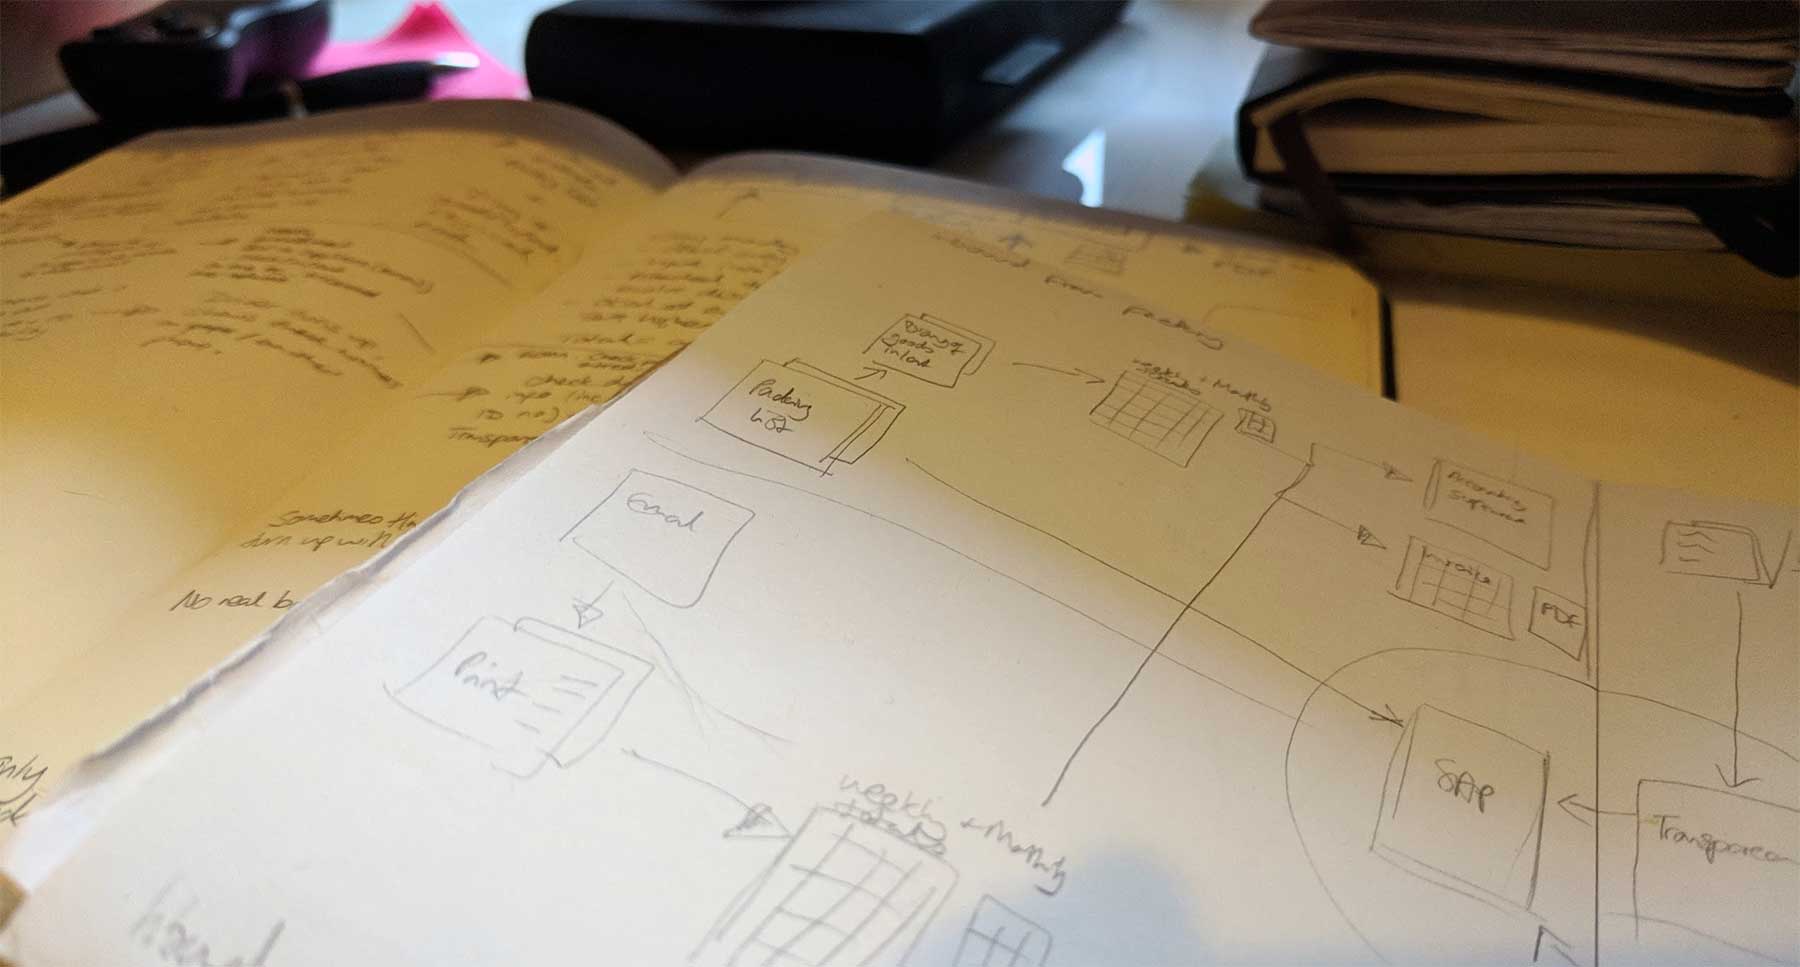
Get a space that visible by everyone - a large whiteboard space, some paper to cover a table, or a wall and post-its - and use a facilitator to capture notes. Don’t worry about the presentation or layout of it initially - scribble away and worry about filling in details or making it more easy to understand later.
Individually
If you’re not able to get a group together, depending on the complexity of the mapping you’ll still probably need to speak to quite a few people.
A really useful prompt is to ask people to describe a specific task or workflow. “Could you talk me through what happens when you need to send out a shipment?” Capturing the process will allow you to pull out the individual elements involved at each point, and understand the key relationships between them. However, unless your scope is purely that area, don’t forget to branch out into understanding the bigger picture.
Back up your findings
Whilst hearing about everything is great, it’s also worthwhile actually seeing the things that you’re talking about. This usually throws up some more questions that people forgot to mention, or didn’t know about. Try to get some system demos, see print-outs of any artefacts, or use existing documentation (but check it’s up to date!).
Areas to think about
You’ve got the right people pinned down. You’re being given demos. But what is it that you actually want to capture? Well, let’s just reiterate: it depends on who you’re doing it for, and why.
What are your boundaries?
Draw a box. Label the box. Have a clear idea of it should and shouldn’t cover? This might change, and that’s ok, but you need to be aware of your scope creep. If it helps, go as far as to state the intention of the ‘who’s and ‘why’s as part of what you create.
What’s in the box?
This part’s very much tied to what you’re trying to communicate, but here are some ideas that may be useful for you to include.
What are the individual components?
- What’s used for user interfaces (technologies involved in building front-ends, apps, other touch points or interaction opportunities)
- Products used (e.g. databases, content management systems, customer relationship management, digital asset management)
- ‘Non-digital’/traditional systems (accountancy)
- Third party systems/services
- Manual/non-integrated outliers (paper, spreadsheets, workarounds etc)
- Who are the people involved
What’s the underlying infrastructure/environment?
- Infrastructure
- Deployment tools
- Automation/task runners
- Monitoring
How does data get moved around?
- APIs
- Manual processes
- Scheduled tasks
- Automated transfer + triggers
Making the most of your mapping
Once you’ve got this captured, the next step is to use it. It doesn’t matter whether your output is a scrappy sketch, or a beautiful piece of art that gets stuck on a wall - remember to refer back to your original goals and ensure that whatever you’ve created helps you to achieve these.
As always, if you’d like any further information on the above, or want help with carrying out a similar activity, please get in touch.
Happy mapping!
Posted by Sally Lait
Sally is the lead consultant and founder of Records Sound the Same, helping people with digital transformation. She's also a speaker, coder, gamer, author, and jasmine tea fiend.